In this article, we will be focusing on Collectd by doing an overview of Collectd and some advanced stream processing options in Riemann.
This article is the last of a 3 part how-to series, where we have highlighted how to build your own monitoring system using Riemann (part 1) and Graphite (part 2).
Collectd Overview
Collectd is a daemon and gathers metrics from various sources, e.g. the operating system, applications, log files, and external devices. Collectd than stores this information or makes it available over the network.
Collectd in of itself is a big topic to discuss and there are a lot of things you can achieve with it. For this article, we will be narrowing it down and focusing on how to set up Collectd to send metrics to the Graphite server.
Collectd Installation and Plugin Concept
To start, you will need to install Collectd from your Linux repository, according to the version of your Linux distribution.
For this specific case, we will have 2 steps for the install:
Type “sudo apt-get install Collectd”
The service will then start Collectd
After these two steps, Collected is now installed and running.
Next, we will need to look at a config file that is related to Collectd.
In our case, it is located at [/ect/collectd/collectd.conf ]
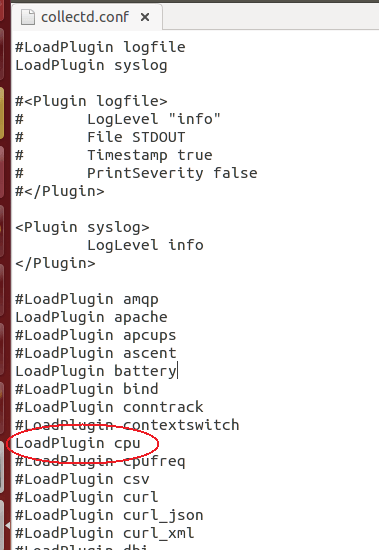
If you open this file, you will see a list of plugins and configurations related to each plugin.
In Collectd, we have the concept of plugins and we need different types of plugins to fetch different types of metrics and monitoring activity.
The image to the left is a plugin to fetch cpu related info of the system on which Collectd is running.
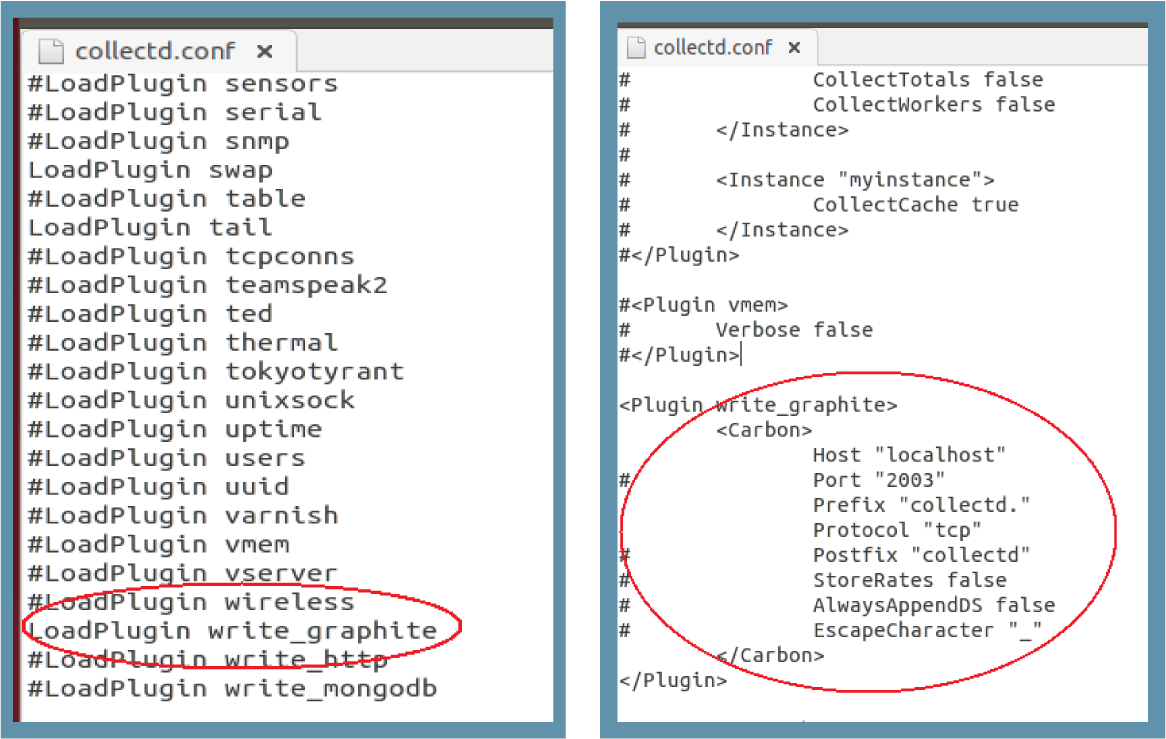
Now, if we want Collectd to forward these metrics to Graphite, we will need a plugin for that action to be completed.
First, we are defining write_graphite plugin and second, we are providing a config for that plugin. The host name of the Graphite server is localhost, as it is installed in the same VM. All Collectd related graphs will be rendered in Graphite under the prefix name that we have set here.
After adding the Graphite related plugin, save the file and restart the Collectd service.
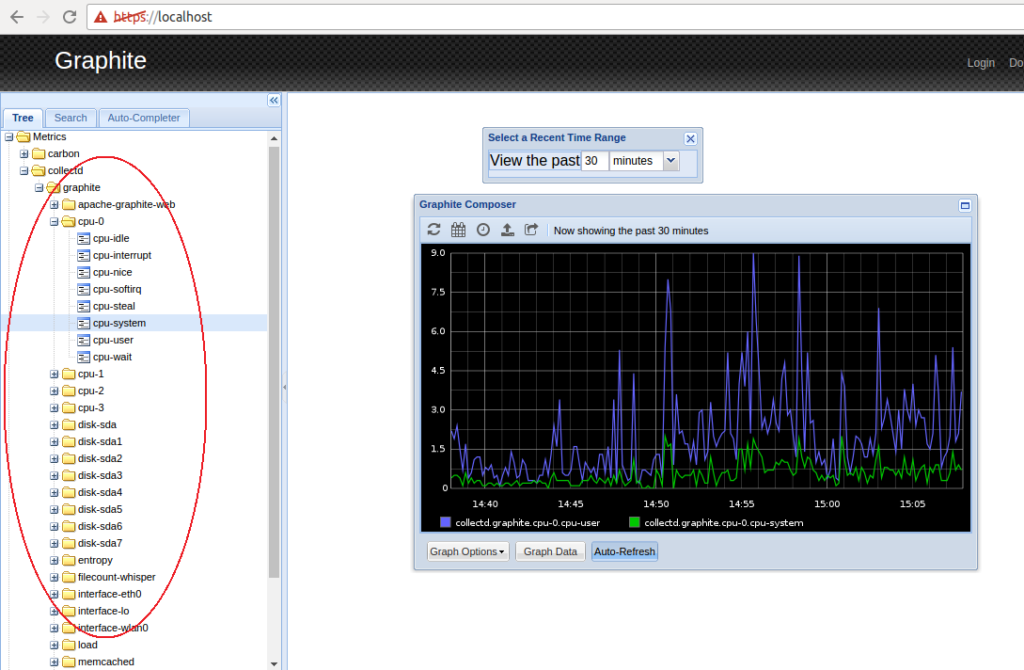
Below is the outcome on the Graphite dashboard for Collectd:
Riemann Stream Processing Examples
In this section, we will be showing stream processing examples in Riemann.
1) Send Emails Based on Service Status
Below is the configuration for sending an email from Gmail. Similarly, this can be done with your SMTP.
Add this configuration in your riemann.config file and restart Riemann.
RiemannClient c = RiemannClient.tcp("localhost", 5555);
c.connect();
try {
// some business logic
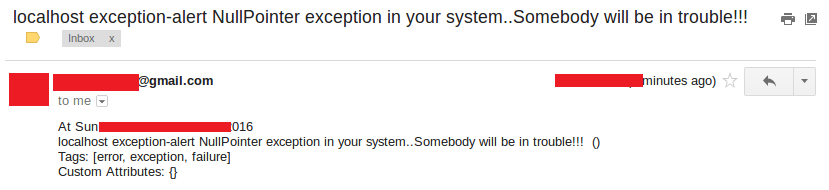
throw new NullPointerException("NullPointer exception in your system..Somebody will be in trouble!!! ");
} catch (Exception e) {
c.event().
service("exception-alert").
state(e.getLocalizedMessage()). // you can send full stacktrace also
tags("error", "exception", "failure").
send().
deref(5000, java.util.concurrent.TimeUnit.MILLISECONDS);
}
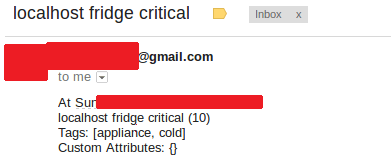
Below is the email received in xyz@gmail.com:
Other Options:
Send an email alert if some VM/service is down.
Filter and process stream depending on hostname, service name, metric value, service state, tag values etc. and perform actions based on that.
You can set threshold values for metrics received and perform actions if the threshold value is crossed. e.g: VM cpu is very high, above 95%, some business-specific constraint value is violated.
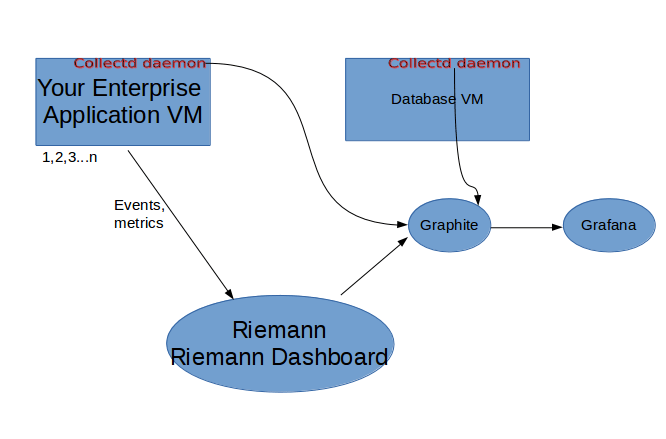
Below is the updated architecture diagram:
Collectd daemon will send all system-related generic metrics to Graphite.
Conclusion
In this three-part how-to series, we have gone over the basics of how to build a monitoring system using Riemann, Graphite, and Collectd.
Do you have any pointers that you would like to share? Please feel free to comment below.
Linux coding hacks are a great thing. They are even better when they are quick, useful, and a little bit of fun. At BETSOL, a vast majority of our eng...
The smart home is an exciting new frontier for many companies developing the technologies and services to power it. This article provides 3 of the top...
Over the past few years, software deployments have become easier due to the popularity of containerization.
Even though deployments may be easier the...