The main components we will discuss are:
- Riemann
- Graphite
- Collected
For this particular exercise, we are using Ubuntu 14.04.5 LTS. However, you are able to use any other Linux distribution. This tutorial will show the installation steps for Ubuntu. If you are using other Linux distributions, there are numerous tutorials available online.
Let’s start with the opensource tool called Riemann.
Check out our other favorite opensource software, Zmanda!
Terms to Know
Riemann: is a network event stream processing system, in Clojure.
Network: Servers become accessible on a network when you start Riemann. It will start a server port and then listens on that port for events.
Event: An event in the application has data and specific metrics associated with it. They can be stored and analyzed. The event is the base of how data flows into the system.
Stream Processing: With both networks and events set up, the user now has a flow of events coming into Riemann. Once this happens it is now time to come up with a plan for that stream of events by creating some rules for the processing of the events.
Clojure: The event processing rules in Riemann. Written as a Clojure script in Riemann.config file.
- Download the Riemann installer of your preference (.deb, .rpm , .tar) from http://riemann.io/
- Install. For this case, we will run the .deb file.
- Once Riemann is installed we want to download some utilities and a dashboard for Riemann.
- *For that ruby will be needed.
- Run below commands to download the dashboard and utility.
- sudo apt install ruby
- sudo gem install Riemann-client Riemann-tools Riemann-dash
Starting Riemann Dashboard
Let’s start Riemann and Riemann-dash
1) service Riemann start OR Riemann OR Riemann /etc/Riemann/riemann.config
You can start Riemann using any one of the above commands.
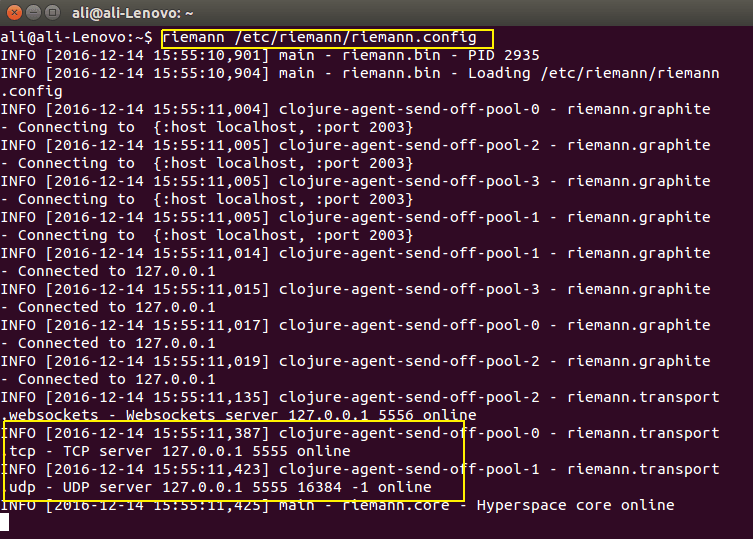
The Riemann server has started to listen on port 5555. This is the default port configuration. You can always override that setting from the Riemann.config file.
2) Run command: Riemann-dash
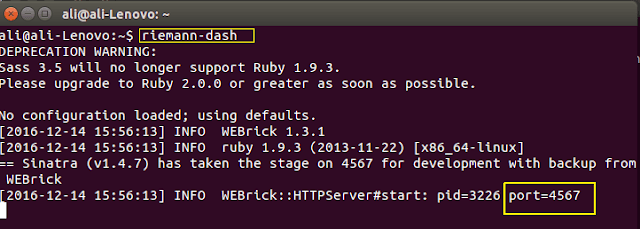
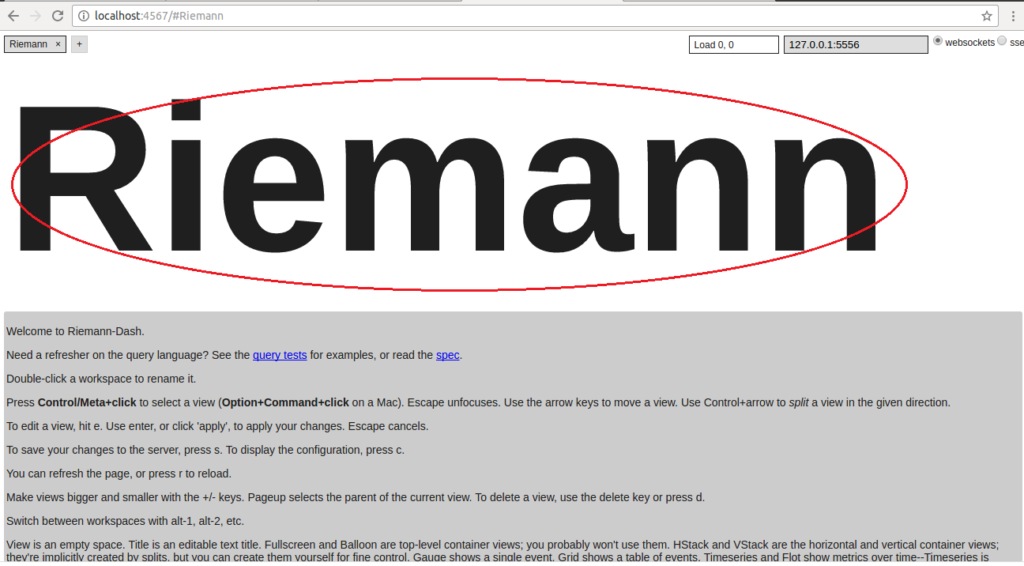
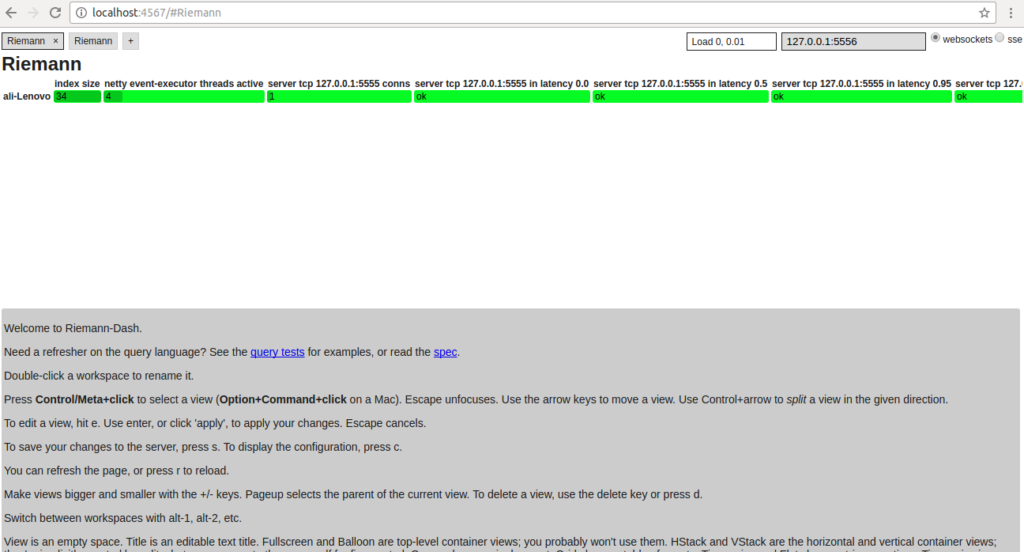
The Riemann dashboard has started on port 4567 and we can now open it in the browser shown below.
4). Work Through Dashboard
The next step is to press “Ctrl” and click on the area that you see marked with a red circle in the above image.
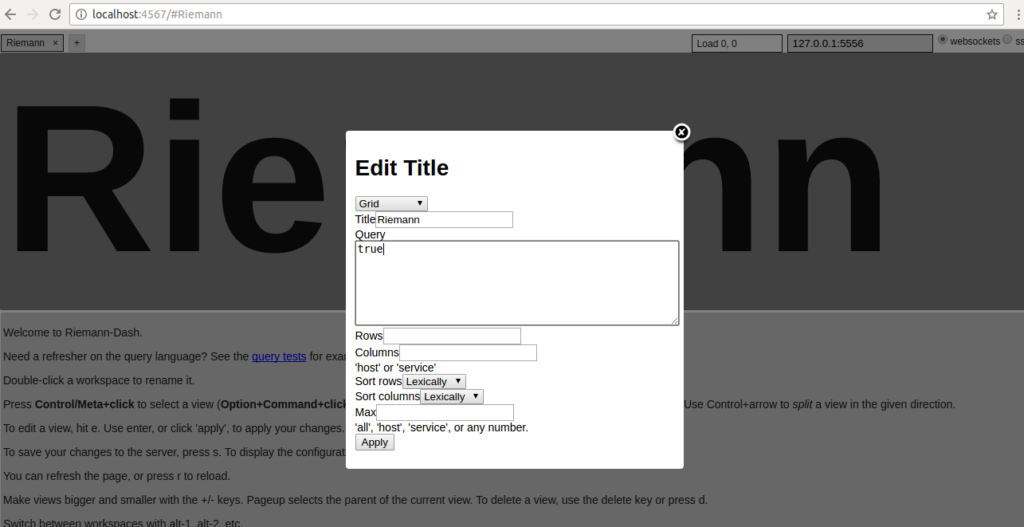
Once it is clicked, press “e” on the keyboard and you will see one popup window. Populate the values of that popup. Example in the image below.
The image shows “true” in the query section. This means that all the display streams are flowing into Riemann.
5). Apply
Once you click on “Apply”, you can see some system events being sent.
Riemann-Clients
The Riemann server is now up and running. The next step is to send the user-defined events for our application to Riemann for processing.
On the Riemann client’s page, you can see that it already has a client library present for C, C++, C#, Clojure, Elixir, Erlang, Go, Java, Lua, Node.js, OCaml, Perl, Python, just to name a few. There are many other tools, programs, and plugins that can be easily integrated with the opensource tool, Riemann.
For this example, Riemann-java-client is being used and we will send our own user-defined events from this java program using the Riemann java client library.
Pom file structure:
<?xml version="1.0" encoding="UTF-8"?>
 <project xmlns="http://maven.apache.org/POM/4.0.0"
      xmlns:xsi="http://www.w3.org/2001/XMLSchema-instance"
      xsi:schemaLocation="http://maven.apache.org/POM/4.0.0 http://maven.apache.org/xsd/maven-4.0.0.xsd">
   <modelVersion>4.0.0</modelVersion>
   <groupId>com.ali</groupId>
   <artifactId>riemann</artifactId>
   <version>1.0-SNAPSHOT</version>
 <repositories>
   <repository>
     <id>clojars.org</id>
     <url>http://clojars.org/repo</url>
   </repository>
 </repositories>
   <dependencies>
     <dependency>
       <groupId>io.riemann</groupId>
       <artifactId>riemann-java-client</artifactId>
       <version>0.4.2</version>
     </dependency>
   </dependencies>
 </project>
The below example is from a java class that has been copied from the riemann-java client git homepage with some modifications.
 import io.riemann.riemann.client.RiemannClient;

 import java.io.IOException;


 public class BasicEventTest {
   public static void main(String... args) throws IOException, InterruptedException {
     RiemannClient c = RiemannClient.tcp("localhost", 5555); // creating connection object
     c.connect();  // connecting to riemann server
     int temperature = 1;
     while (true) {
       if (temperature > 10) temperature = 1;
       Thread.sleep(1000);
       c.event().                // creating event
           service("fridge").
           state("running").
           metric(temperature++).
           tags("appliance", "cold").
           send().              // sending event
           deref(5000, java.util.concurrent.TimeUnit.MILLISECONDS);
     }
   }
 }
The Process:
- Creating Riemann client which will connect to the specified Riemann server.
- Creating an event and giving a service name, state, metric value, tags for extra metadata; then sending it to the Riemann server.
Once this program runs, you will be able to see the event on the Riemann dashboard.
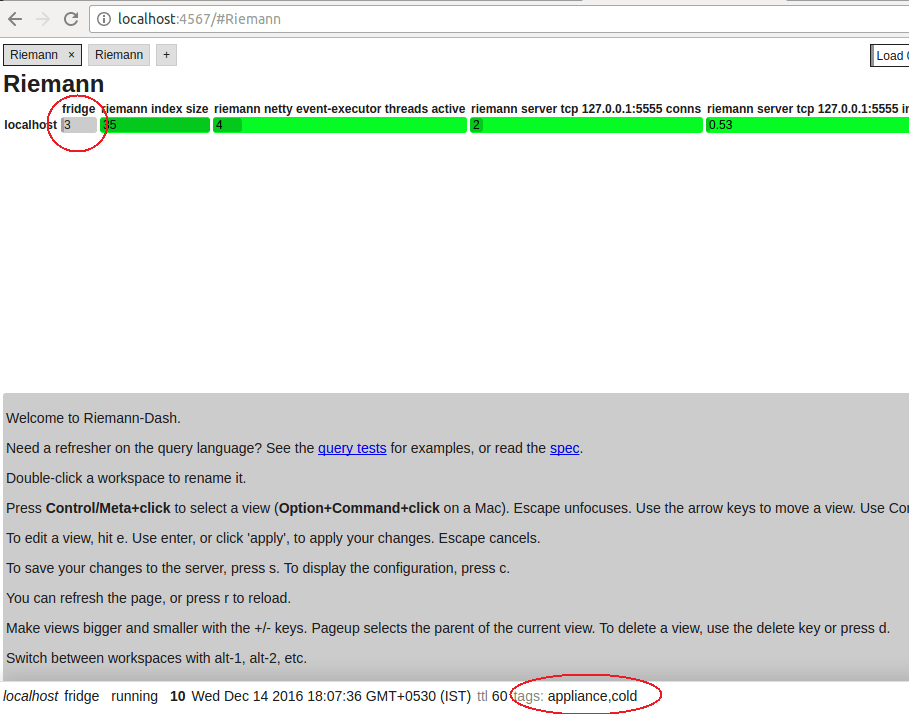
The temperature we are sending as a metric value is associated with the service name “fridge”. Once you click on the fridge service it will show more details it is associated with down below.
In this case, the value of temperature is changing every one second because we are sending a new metric value every 1 second in our java program. The TTL value here is 60. Each event will be present in Riemann for 60 seconds only. You can configure it in Riemann.config file.
*Point to remember: this will be the main point of need for Graphite coming in part 2.
This service and metric is a dummy.
Final Example of an Event Sent From Java Application:
 import io.riemann.riemann.client.RiemannClient;

 import java.io.IOException;
 import java.lang.management.ManagementFactory;
 import java.lang.management.MemoryMXBean;

 public class BasicEventTest {
   public static void main(String... args) throws IOException, InterruptedException {
     RiemannClient c = RiemannClient.tcp("localhost", 5555);
     c.connect();
     while (true) {
       Thread.sleep(1500);
       MemoryMXBean memoryMXBean = ManagementFactory.getMemoryMXBean();
       c.event().
           service("jvm.nonheap.memory").
           // state("running").   state is not needed here
           metric(memoryMXBean.getNonHeapMemoryUsage().getUsed() / 1024).
           tags("jvm nonheap used memory").
           send().
           deref(5000, java.util.concurrent.TimeUnit.MILLISECONDS);
     }
   }
 }
In this example we are sending JVM non-heap used memory using Memory Mbean and sending its value to Riemann.
Similarly, we can send all JVM related metrics like JVM CPU, thread count, heap memory usage, and more using Mbeans.
What is Next?
Keep an eye out for part 2 where we will cover Riemann integration with Graphite and dive into why it is needed.
Check out more of our how-to articles like How to Get Started with Selenium Automation