Learn How to Build a Monitoring System Using Riemann
In this article, we will dive into how to integrate Riemann with Graphite, but first, let’s discuss why we need Graphite.
In case you missed part one, you can find the article here. Part one went over how to install Riemann and basic event sending from java application.
Here is some helpful info before we get started:
- In Riemann, the events are stored only until the TTL-time to live- value. In order to look at future statistics and get an idea about system behavior at the time of failure or error scenarios, we need something to store the events for a longer term.
- Riemann is a stateless system as well as the Riemann-dashboard. Even though there are ways to store the definition of created dashboards, they will show live data only.
Graphite has two great capabilities:
1. Storage
2. Easy and powerful dashboard UI.
Let’s start with Graphite installation.
Graphite Installation
In this link, you can see that there are four different ways of installing graphite and the other components that are needed.
For this exercise, we are using option four: Installing from Synthesize.
Synthesize provides a script which automates the installation of all necessary dependency and the components that are needed for Graphite. However, the Synthesize installation method is only available for the Ubuntu 14.04 version only.
Installation steps for this case:
$ cd synthesize
$ sudo ./install
Simple as that.
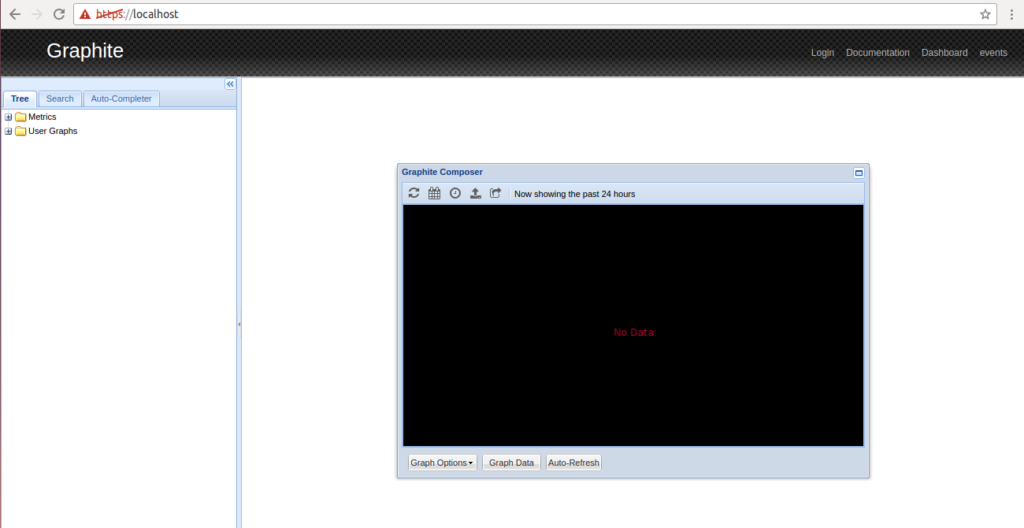
The next step is to open the Graphite dashboard in the browser:
Let’s now integrate Graphite with Riemann.
Riemann Graphite Integration
Open riemann.config file. In this case, it is located at /etc/riemann/riemann.config
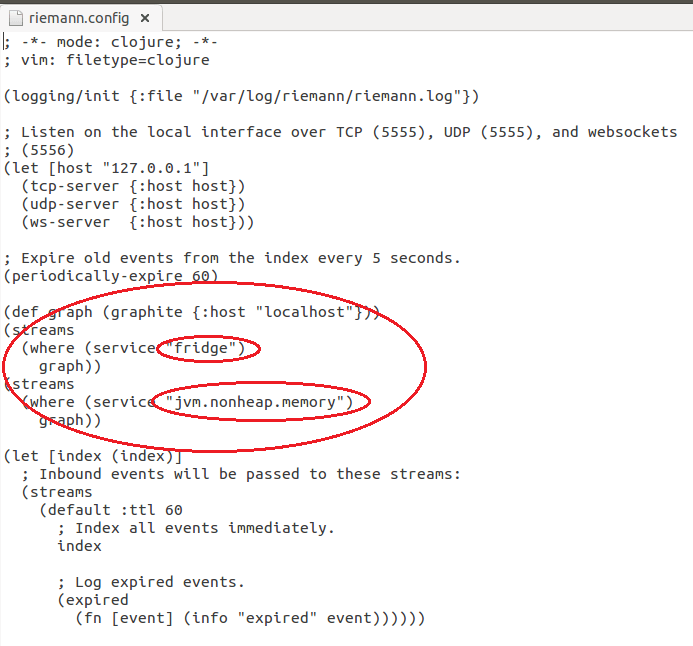
The highlighted text is the newly added configuration for Graphite.
First is the location of Graphite VM. In this case, it is the same machine so we are using localhost.
The next step is to stream the processing rules. You can specify which services you want to render on Graphite. Here we are declaring both “fridge” and “jvm.nonheap.memory” service to render on the Graphite dashboard. Learn how to create this service here.
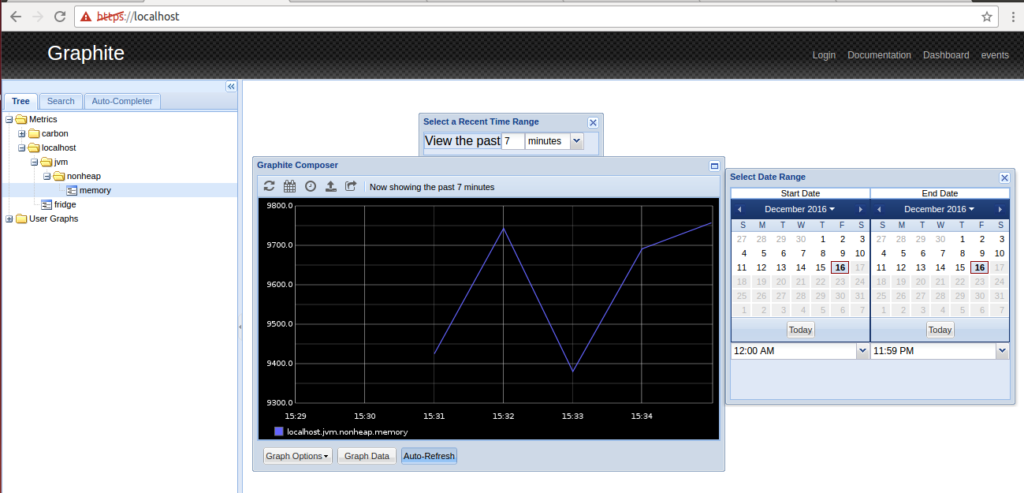
As you can see, Graphite has capabilities to store the metrics so that you can configure the time/date range. You can also see that Graphite creates new folder structures for each “.” present in the service name. You can see the jvm.nonheap.memory folder structure here. This allows you to organize and send your metrics accordingly.
What is Next?
Grafana is the next thing that you can add to your framework. Grafana is a dashboard which can operate upon the data stored in Graphite storage. In short, Graphite will be there but Grafana can use Graphite’s data and provide much much better and advanced dashboard options. Learn more about Grafana here.
Below is the updated architecture diagram:
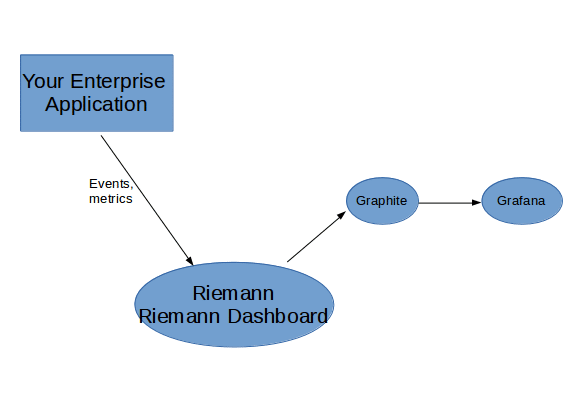
Riemann processes the events and pushes the metrics data associated with events to Graphite for storage. Graphite stores it and displays it on the dashboard. Grafana can even leverage the data present with Graphite for further rendering.
To learn more coding tricks check out How to Obfuscate Code In 6 Easy Steps